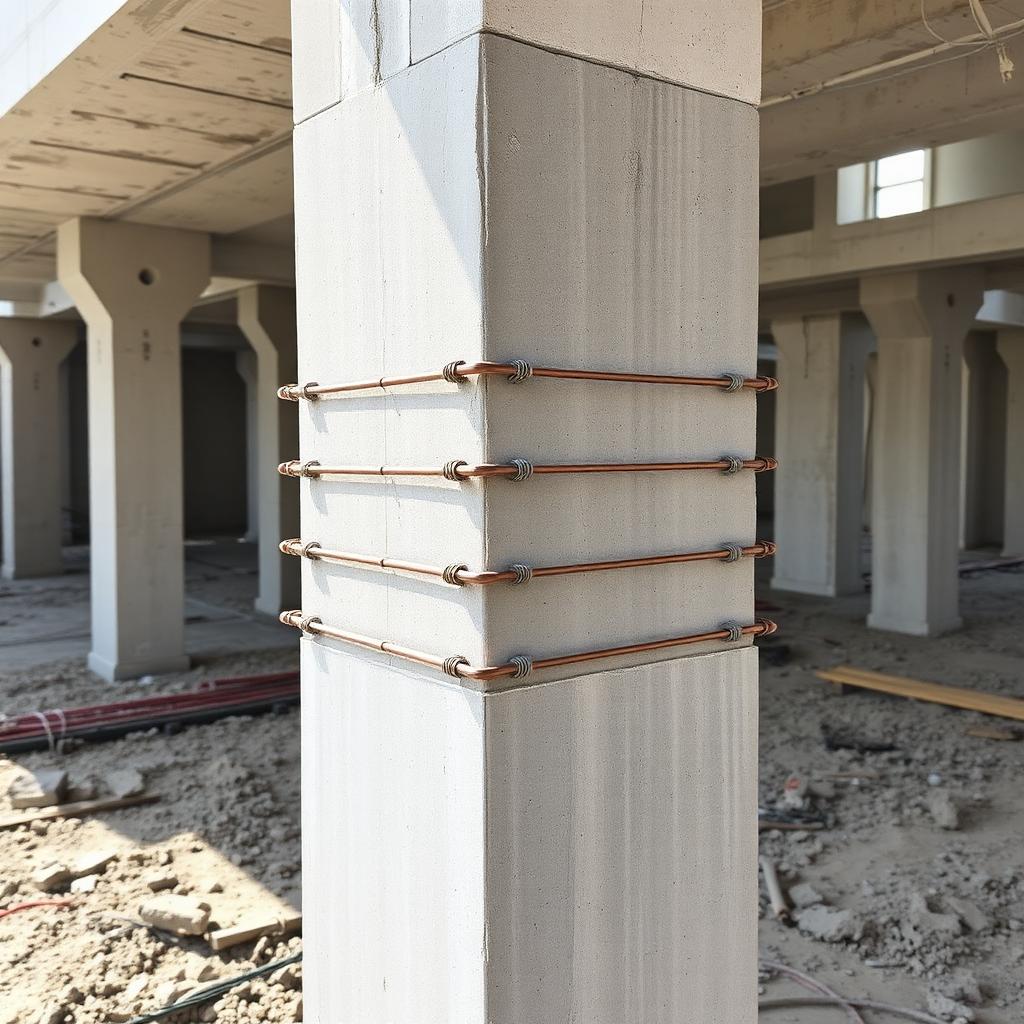
 Objective 01
Compute φPn,max (short column)
Tied: 0.80·φ·[0.85 f'c(Ag−Ast) + fy·Ast], φ=0.65. Spiral: 0.85·φ·[…], φ=0.75.
- Why it matters
- Baseline pure-axial capacity.
- Where it is used
- Every column check.
- Connects to
- ACI 22.4.2.
A century of steel — from concept to skyline
Concrete crushes; steel yields. Together they carry a column.
φPn,max = 0.80·φ·[0.85·f'c·(Ag − Ast) + fy·Ast] for tied; ×0.85 for spiral.
Chapter 26 covers short RC columns under axial and P–M interaction: tied vs spiral detailing, φPn,max, and the P–M interaction diagram.
What you will be able to do after finishing Chapter 1 — and why each objective matters in practice
Objective 01Tied: 0.80·φ·[0.85 f'c(Ag−Ast) + fy·Ast], φ=0.65. Spiral: 0.85·φ·[…], φ=0.75.
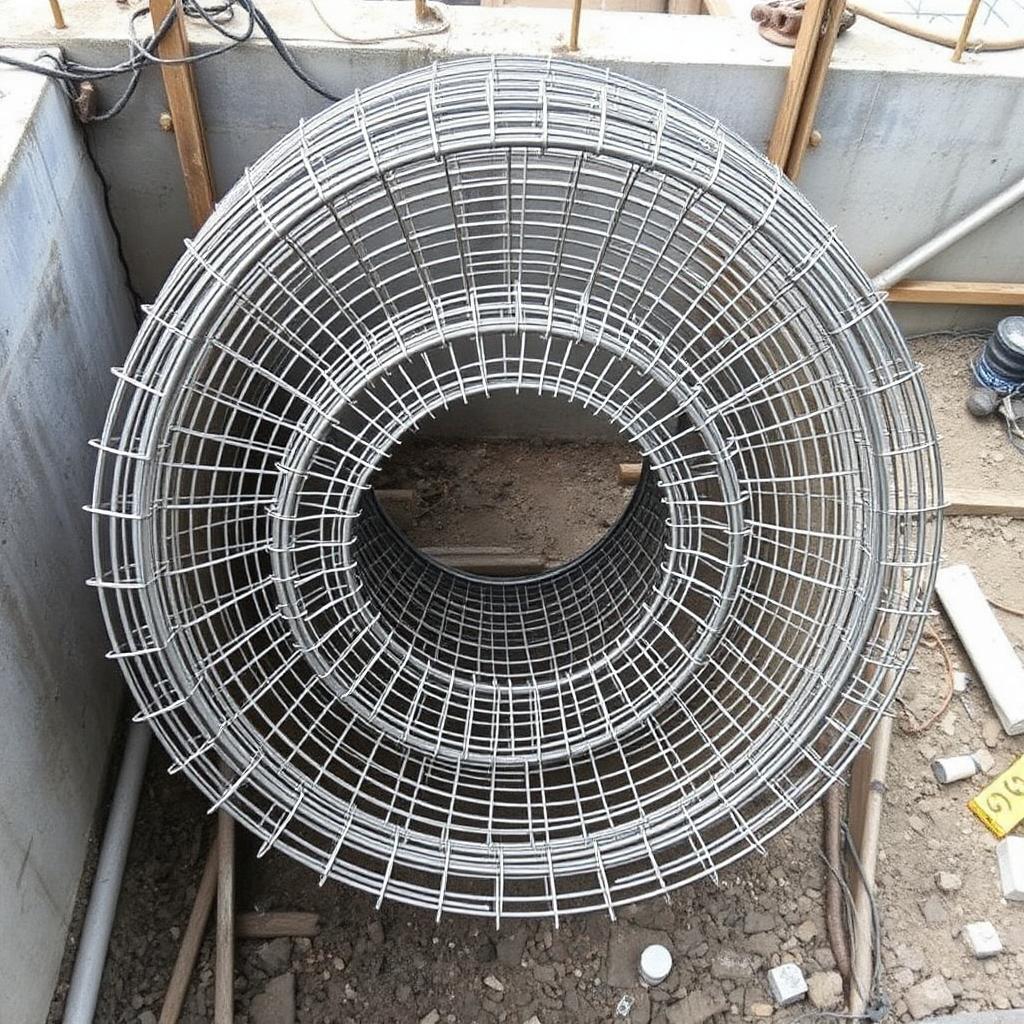 Objective 02
Ties resist rebar buckling laterally; spirals also confine the core and boost ductility.
 Objective 03
1% ≤ ρg = Ast/Ag ≤ 8% (typically ≤ 4% for constructability).
Objective 04Points: pure axial (top), balanced (P = Pb, M = Mb), pure flexure (bottom).
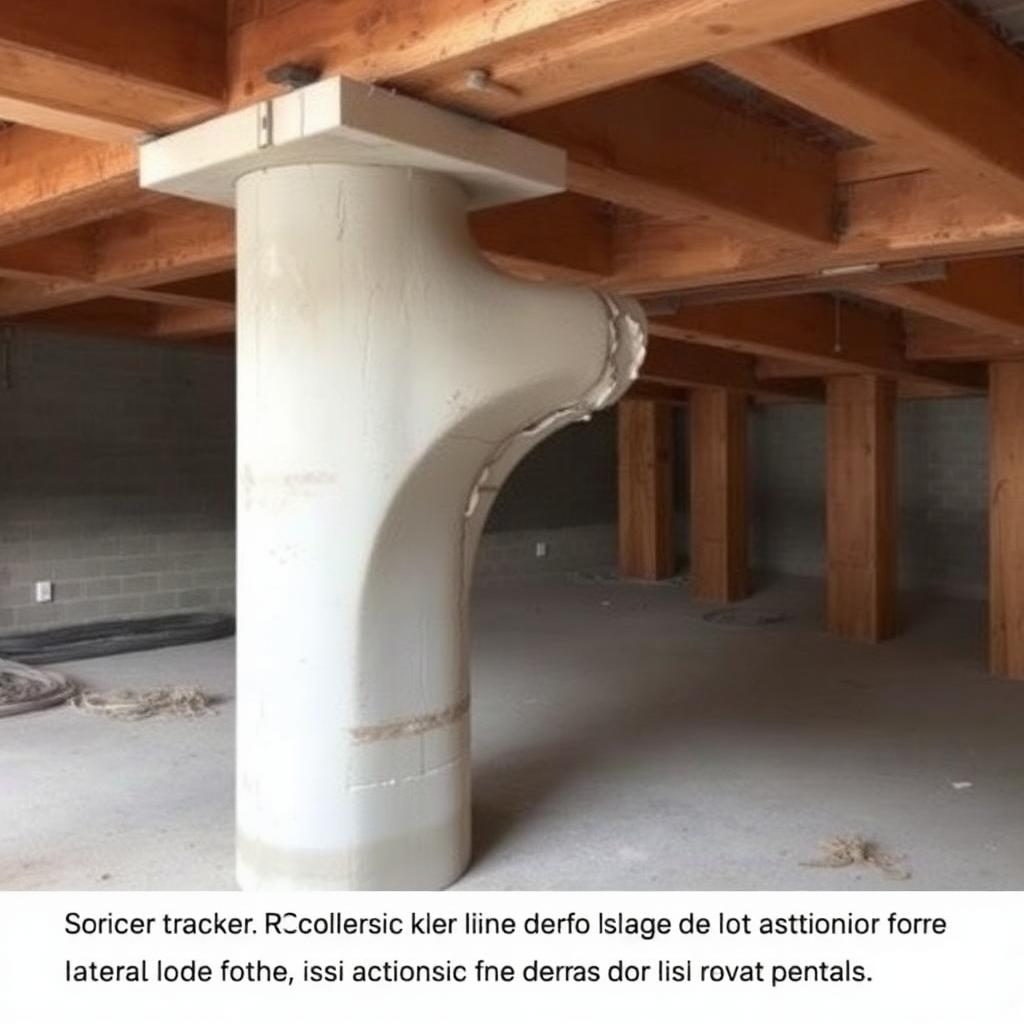 Objective 05
Short if klu/r ≤ 22 (unbraced) or ≤ 34 − 12·M1/M2 (braced).
Objective 06Pick c, compute As, plot on P–M interaction, iterate.
What each part of a steel-frame building actually does — and why it exists
Before you design any single member, you have to see the whole system. A steel-frame building is not a collection of independent shapes bolted together — it is a deliberate load path, engineered so that every kilonewton of gravity, wind, or seismic demand has a continuous route from where it starts to the ground where the earth can resist it.
The photograph below shows a typical steel framing detail. Drag each labelled chip onto the structural element it names — the drop is only accepted when it lands inside the correct element's outlined region. A correct answer locks in with a green outline and a short explanation; a wrong answer flashes the region red, tells you what you actually hit, and returns the chip so you can try again. Press Reveal expected placements to see the reference solution (that attempt is then marked as assisted).
Why we design the way we do — six ways steel structures have failed, and what each disaster taught the profession
Every provision in AISC 360 is a scar. Behind each equation, load factor, and detailing rule is a bridge, a walkway, or a tower whose failure cost lives and rewrote the profession. The six case studies below trace the mechanisms that motivate the code you are about to learn.
Read each one as an engineer, not a spectator: identify the load, the limit state, the missing check, and the specific clause that exists today because that check was missed. When you meet those clauses again in Chapters 5–17, they will read as answers, not rules.
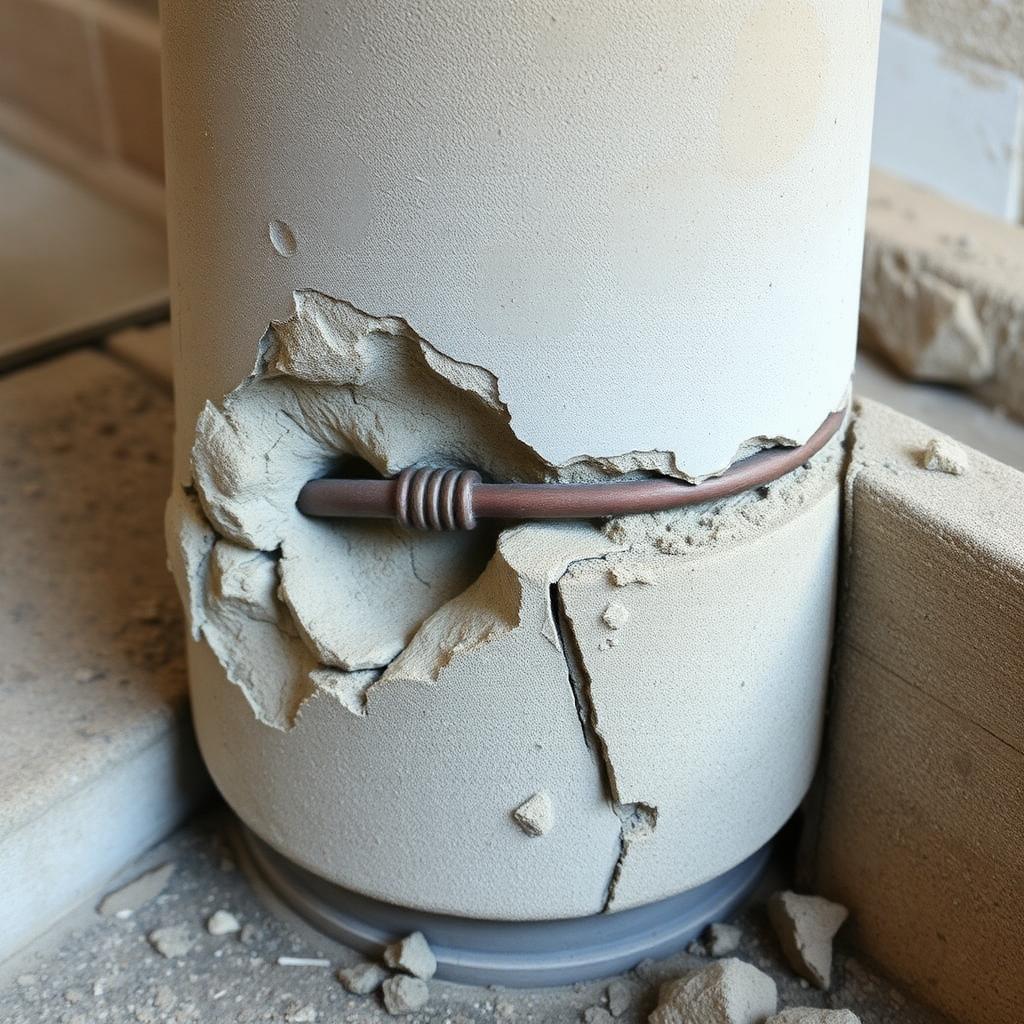
Cover spalls; longitudinal bars buckle between ties.
Ties too widely spaced.
Long column bows out under axial + lateral load.
Slenderness > 22 (unbraced) not treated.
Design codes intervene at the transition from yield to instability. Everything before yield is elastic and reversible; everything after instability is a race to collapse. LRFD keeps the demand well below the first transition.
The full textbook chapter — figures, equations, and engineering narrative
Tied and spirally reinforced columns have similar axial capacity but very different failure modes. Which one would you specify in a seismic zone, and why does the confinement geometry change the ductility so dramatically?
This chapter opens the study of reinforced concrete columns, with particular emphasis on short, stocky columns subjected to small bending moments. Such columns are often said to be "axially loaded." Short, stocky columns with large bending moments are covered later, while long or slender columns are treated in the slenderness chapter. Concrete columns can be classified into three broad compression categories:
A plain concrete column carries very little load, but capacity is greatly increased when longitudinal bars are added. Further gains follow from providing lateral restraint for those bars: under compression the concrete tends to shorten lengthwise and expand laterally (Poisson effect), and closely spaced closed ties or helical spirals wrapping the longitudinal steel supply that restraint.
Perfectly axially loaded columns do not exist in practice, but the theoretical pure-axial capacity is an excellent starting point. Decades of testing show that the ultimate stress the concrete can reach in a column is well approximated by 0.85·f'c. It does not matter much whether concrete or steel approaches its ultimate strength first: if one is stressed close to its limit, its large deformation transfers stress to the other. Therefore the pure axial nominal capacity of a short column is
where Ag is the gross cross-section area (concrete + steel) and Ast is the total area of longitudinal reinforcement.
Tied columns. As a short tied column is loaded to failure, the outer concrete shell spalls off. Unless the ties are closely spaced, the longitudinal bars then buckle outward once their lateral support (the covering concrete) is lost — the failure can be sudden, and such failures have been reported frequently in structures subject to earthquake loading.
Spiral columns. When a spiral column is loaded to failure, the shell spalls, but the confined core continues to stand. If the spiral is closely spaced, it develops hoop tension and confines the core, allowing the column to resist additional load beyond what caused spalling. The closely spaced spiral and longitudinal bars form a cage that keeps the core intact, so the spalling of the shell provides a warning that failure is going to occur if the load is further increased. American practice is to neglect any excess capacity after the shell spalls off.
Here Ac is the core area (out-to-out of the spiral). Tests show the lateral hoop pressure produced by the spiral increases the confined core capacity by roughly twice that of the same weight of longitudinal steel — the origin of the 2·ρs·fyt term used in the ACI minimum-spiral-ratio expression.
How this chapter is organized. Real columns rarely carry pure axial load — they are always bent as well. We build up from that fact: (1) the six eccentricity cases that trace the boundary of a column's strength, (2) the plastic centroid that the resultant load must pass through at failure, (3) strain compatibility → Pn, Mn for any strain distribution, (4) the P–M interaction diagram, (5) the ACI code modifications (φ, 0.80/0.85 caps), (6) how to read the standardized ACI interaction charts, and (7) tied vs spiral confinement.
All columns are subject to some bending. The code approximates this by requiring minimum eccentricities (0.10h tied, 0.05h spiral) even for "axial" columns. As eccentricity e = M/P grows from zero to infinity, the failure mode migrates through six regimes:
The plastic centroid is the point through which the resultant column force must pass to produce uniform strain at failure — all concrete at 0.85f'c and all steel at fy. Eccentricity e is measured from the plastic centroid, not the geometric center. For a symmetrical section the two coincide; for a T- or unsymmetrical section they don't.
Worked Example 26.1 — T-section plastic centroid. Composite unsymmetrical section: left rectangle 6″ wide × 16″ tall (b1 = 6, h1 = 16), right rectangle 8″ wide × 8″ tall (b2 = 8, h2 = 8) attached to the right face and bottom-aligned. 4 #9 bars centered near the interface (xs = 7 in), Ast = 4.00 in², f'c = 4 ksi, fy = 60 ksi. Total width = 14 in.
Fix εc = −0.003 on the compression edge, pick any strain on the far edge, and the strain field is linear (plane sections). From there you get c, εs, ε's, then the resultants Cc, C's, Ts. Statics gives one (Pn, Mn) point.
Worked Example 26.2 — one interaction-diagram point. 14×24 in tied column, 6 #9 bars (3 top, 3 bottom, As = A's = 3.00 in²), 2.5-in cover to centroids, f'c = 4 ksi, fy = 60 ksi. Assumed strains: εc = −0.003 on compression edge, +0.002 on far edge.
Repeat with different far-edge strains to sweep the whole diagram: εt → ∞ gives point (Po, 0); εt = εy gives the balanced point; Pn = 0 gives the pure-flexure point.
Design a square tied column to support an axial dead load D = 130 k and an axial live load L = 180 k. Try ρg ≈ 2% longitudinal steel; f'c = 4,000 psi, fy = 60,000 psi.
Design a round spiral column for PD = 240 k, PL = 300 k. Try ρg ≈ 2%; f'c = 4,000 psi, fy = 60,000 psi.
Continuation of Ex 26.4. Ø 18 in column with 1½ in cover → core diameter Dc = 15 in; core area Ac = π(15)²/4 = 177 in². Try #3 spiral (db = 0.375 in, as = 0.11 in²).
Doing strain-compatibility for every column is tedious, so ACI SP-17 publishes normalized interaction diagrams keyed on:
How to read this chart (the exam procedure).
Reverse use — given a section, find Pn at an eccentricity. Draw the radial line for the known e/h from the origin. Where it crosses the ρg curve of the given reinforcement, read Kn (and Rn) → back out Pn = Kn·f'c·Ag. This is exactly the workflow of Example 26.10 below.
Why the different φ. A spiral column confines its core: when the concrete cover spalls at ultimate, the spiral engages the interior concrete and the column keeps carrying load in a ductile manner. Tied columns simply crush once the cover pops. Same mechanism, better outcome for spirals → 15% higher φ and 20% larger Pn,max coefficient.
14 × 20 in tied column, cover to bar centroid = 2.5 in, f'c = 4 ksi, fy = 60 ksi. Loads: PD = 125 k, PL = 140 k, MD = 75 ft-k, ML = 90 ft-k. Select Ast using ACI SP-17 charts (bars on two end faces).
Interpolate between γ = 0.70 chart (ρg ≈ 0.0220) and γ = 0.80 chart (ρg ≈ 0.0185) → ρg ≈ 0.0202.
Verify: because the SP-17 curves used correspond to fs/fy < 1.0 (εt < εy), the section is indeed compression-controlled → the assumed φ = 0.65 is correct. Then check ACI 25.7 tie detailing.
Design a short square tied column. Pu = 600 k, Mu = 80 ft-k, f'c = 4 ksi, fy = 60 ksi. Bars uniformly around all four faces.
Interpolating "bars on four faces" ACI charts (γ = 0.60 → ρg ≈ 0.025; γ = 0.70 → 0.022) gives ρg ≈ 0.023.
Short round spiral column, 20-in diameter, f'c = 4 ksi, fy = 60 ksi, Pu = 500 k, Mu = 225 ft-k. Cover to bar centroid = 2.5 in.
Interpolating between ACI round-column charts → ρg ≈ 0.0235.
14-in-wide short tied rectangular column, bars on two end faces, Pu = 500 k, Mu = 250 ft-k, f'c = 4 ksi, fy = 60 ksi, target ρg ≈ 2%.
The 14 × 22 in section hits the target ρg ≈ 2%.
Design lesson. Doubling the depth cuts ρg nearly threefold — depth is the strongest lever for a moment-heavy column. Try to keep 1% ≤ ρg ≤ 4% (ACI 26.9.1.1) for buildable splices.
The 14 × 20 in tied column of Example 26.9 (Figure 10.20 of McCormac) is reinforced with 6 #10 bars on the two end faces. Compute the nominal load Pn that the column can support at an eccentricity of 10 in with respect to the x-axis. f'c = 4 ksi, fy = 60 ksi.
The trick. On the interaction diagram, Rn/Kn = (Pne / f'cAgh) / (Pn/f'cAg) = e/h. So any (Pn, Mn) with the given eccentricity lies on the straight radial line from the origin with slope Kn/Rn = h/e = 2.0. Just walk that radial line until it crosses the ρg = 0.0272 curve.
Take-away. Interaction charts work both ways: forward (given loads → find reinforcement) and reverse (given reinforcement → find capacity at any eccentricity). The reverse workflow is the fastest way to check an existing column against a new load combination.
RC column practice
ABET / licensure link. These points map to ABET Student Outcomes 2 and 4 — engineering design within realistic constraints, and recognition of ethical and professional responsibilities. Expect NCEES FE and PE exam questions on the NSPE Code of Ethics, OSHA construction requirements, and the engineer's standard of care.
Column reinforcement economics
| Line item | Qty | Rate | Cost |
|---|---|---|---|
Option A — 20″×20″, Ast = 6.0 in² | 0.082 ton rebar | $2,200 | $180 |
Option A concrete + forms (12 ft) | 1.23 yd³ installed | $460 | $566 |
Option B — 16″×16″, Ast = 9.0 in² | 0.123 ton rebar | $2,200 | $271 |
Option B concrete + forms (12 ft) | 0.79 yd³ installed | $460 | $363 |
| Estimated total | $1,380 | ||
Takeaway. Nearly a wash (≈$746 vs ≈$634) — choose on floor area, formwork repetition, and constructability, not the spreadsheet alone.
Unit rates are representative US averages for teaching purposes. On a real project, price with current local rates (RSMeans, fabricator quotes, or contractor pricing) and state the estimate date.
Key mechanics visualised — watch the strain profile, stress block, or buckled shape evolve
Under axial load, tied cores spall and lose capacity abruptly (φ=0.65). Spiral cores stay confined and remain ductile (φ=0.75).
Full-page reference diagrams — the visual vocabulary you will use for the rest of the course
Tied columns: 0.80·Pmax factor, φ=0.65.
Spirals confine and boost ductility.
Tie spacing critical.
P-δ magnifies moments.
Full textbook solutions — problem, theory, step-by-step, verification, interpretation
Compute the accidental-eccentricity-capped design axial capacity.
A short 16×16 in tied column has 4 #8 bars (Ast = 3.14 in²), f'c = 4 ksi, fy = 60 ksi. Compute φPn,max.
Pure Pn is capped by 0.80 (tied) or 0.85 (spiral) to account for accidental eccentricity; then multiplied by φ.
ρg in allowable band and Pn cap correctly applied.
Compute the governing variables — hints unlock as you need them
A 14-in-diameter circular SPIRAL column has 6 #6 longitudinal bars (A_st = 2.64 in²), f'c = 4 ksi, f_y = 60 ksi. Compute A_g, ρ_g, P_o, and φP_n,max per ACI §22.4.2, then compare with an equivalent tied section.
Solve the chapter's design task — compute each governing variable
A 16 in × 16 in tied RC column is reinforced with eight #8 longitudinal bars (Ast = 6.32 in²). Compute the nominal axial capacity at zero eccentricity P0, the code cap Pn,max = 0.80·P0 (tied), and the design axial strength φPn,max.
Pick the column configuration that satisfies strength, ρg, and detailing
Design a short RC column for P_u = 480 k, f'c = 4 ksi, f_y = 60 ksi. Compare a 16×16 tied square against a 14-in spiral. Check φP_n,max, ρ_g limits, minimum bar count, tie/spiral detailing, AND ductility posture.
A mind map of how every concept connects
These questions reference ACI 318-19 — sections, equations, and tables are cited explicitly. Use a calculator. Each question offers a clue you may reveal before answering. Submissions are recorded to your account once signed in.
Attach your handwritten or typed step-by-step solution for this chapter's graded quiz. The instructor can download every submission. PDF only, up to 25 MB.
Your file — PDF, Word document, scanned handwriting or a photo — is read page by page like an experienced structural engineering instructor would. The scan is validated first, then your reasoning, structural model, calculations, diagrams, code basis and final answers are graded on process, not just the final number. Design work is additionally reviewed against AISC 360-22 and ACI 318-19. Partial credit applies, and one early mistake carried correctly forward is only penalized once.
NCEES-style practice with timer, equation sheet, and mastery tracking
For a 16×16 tied column, Ast=3.14, f'c=4, fy=60 ksi. φPn,max is closest to: